![How Much are House prices in the Algarve Portugal in 2025](https://algarveprop.com/wp-content/uploads/2025/02/House-prices-in-the-Algarve-Portugal-in-2025-1240x720.png?v=1738840999)
How Much Are Houses to Buy in The Algarve in 2025?
Table of Contents:
- Introduction
- Record High Bank Valuations
- Regional Variations in Property Prices
- National Trends
- Future Outlook
- House Prices in the Algarve in 2025
- Conclusion
- Compare house prices in different regions of the Algarve in Portugal
Introduction
In 2025, Portugal’s real estate market continues its upward trajectory, with significant increases in property valuations and prices across various regions. This trend reflects the country’s robust economic performance and sustained demand in the housing sector.
Record High Bank Valuations
As of July 2025, the average value of homes appraised by banks reached €1,638 per square meter, marking the highest point since the National Statistics Institute (INE) began recording this data in 2011. This represents an increase of €20 from the previous month and signifies the eighth consecutive month of growth—the most substantial rise since January 2023. Consequently, a 100-square-meter house is now valued at approximately €163,800 on average, though this figure varies by region and property type.
Regional Variations in Property Prices
The Algarve region has experienced a notable surge in property prices. In August 2025, there was a 9.3% increase compared to the same month in the previous year, bringing the average price to €3,467 per square meter. Municipalities such as São Brás de Alportel (17.7%), Silves (11.8%), and Tavira (10.4%) led this growth. Conversely, Monchique and Aljezur saw slight declines of 4.9% and 1%, respectively.
In terms of affordability within the Algarve, Monchique (€2,257/m²), Portimão (€2,674/m²), São Brás de Alportel (€2,742/m²), and Olhão (€2,903/m²) are among the more economical municipalities for purchasing homes. On the other hand, Loulé (€4,152/m²), Lagos (€3,964/m²), and Vila do Bispo (€3,735/m²) are the most expensive areas in the region.
National Trends
Nationally, housing prices have risen by 9.1% over the past year, reaching an average of €2,722 per square meter. Significant increases were observed in cities like Ponta Delgada (20%), Leiria (17.2%), and Portalegre (15.4%). Lisbon remains the most expensive city to purchase a home, with prices averaging €5,634 per square meter, followed by Porto (€3,639/m²) and Funchal (€3,428/m²).
Future Outlook For The Algarve
Projections indicate that housing prices in Portugal will continue to rise until at least 2026, driven by structural challenges in the construction sector and growing demand. Despite stabilised material costs, a significant labour shortage—estimated at over 90,000 workers—continues to elevate construction expenses. Between 2015 and 2023, housing prices more than doubled, with an accumulated increase of 105.8%. In 2024, foreign investment in the real estate sector exceeded €2.5 billion, and net migration added over 155,000 people, further fueling demand.
To address the housing shortage, the Portuguese government has approved a bill allowing for the reclassification of rural land for urban use, particularly for affordable housing. This measure enables municipalities to independently make these decisions, aiming to reserve at least 70% of reclassified land for public or affordable housing and setting maximum prices below market rates. The government also plans to invest €4 billion to build around 59,000 homes by 2030 for the neediest families.
House Prices by Municipality in the Algarve:
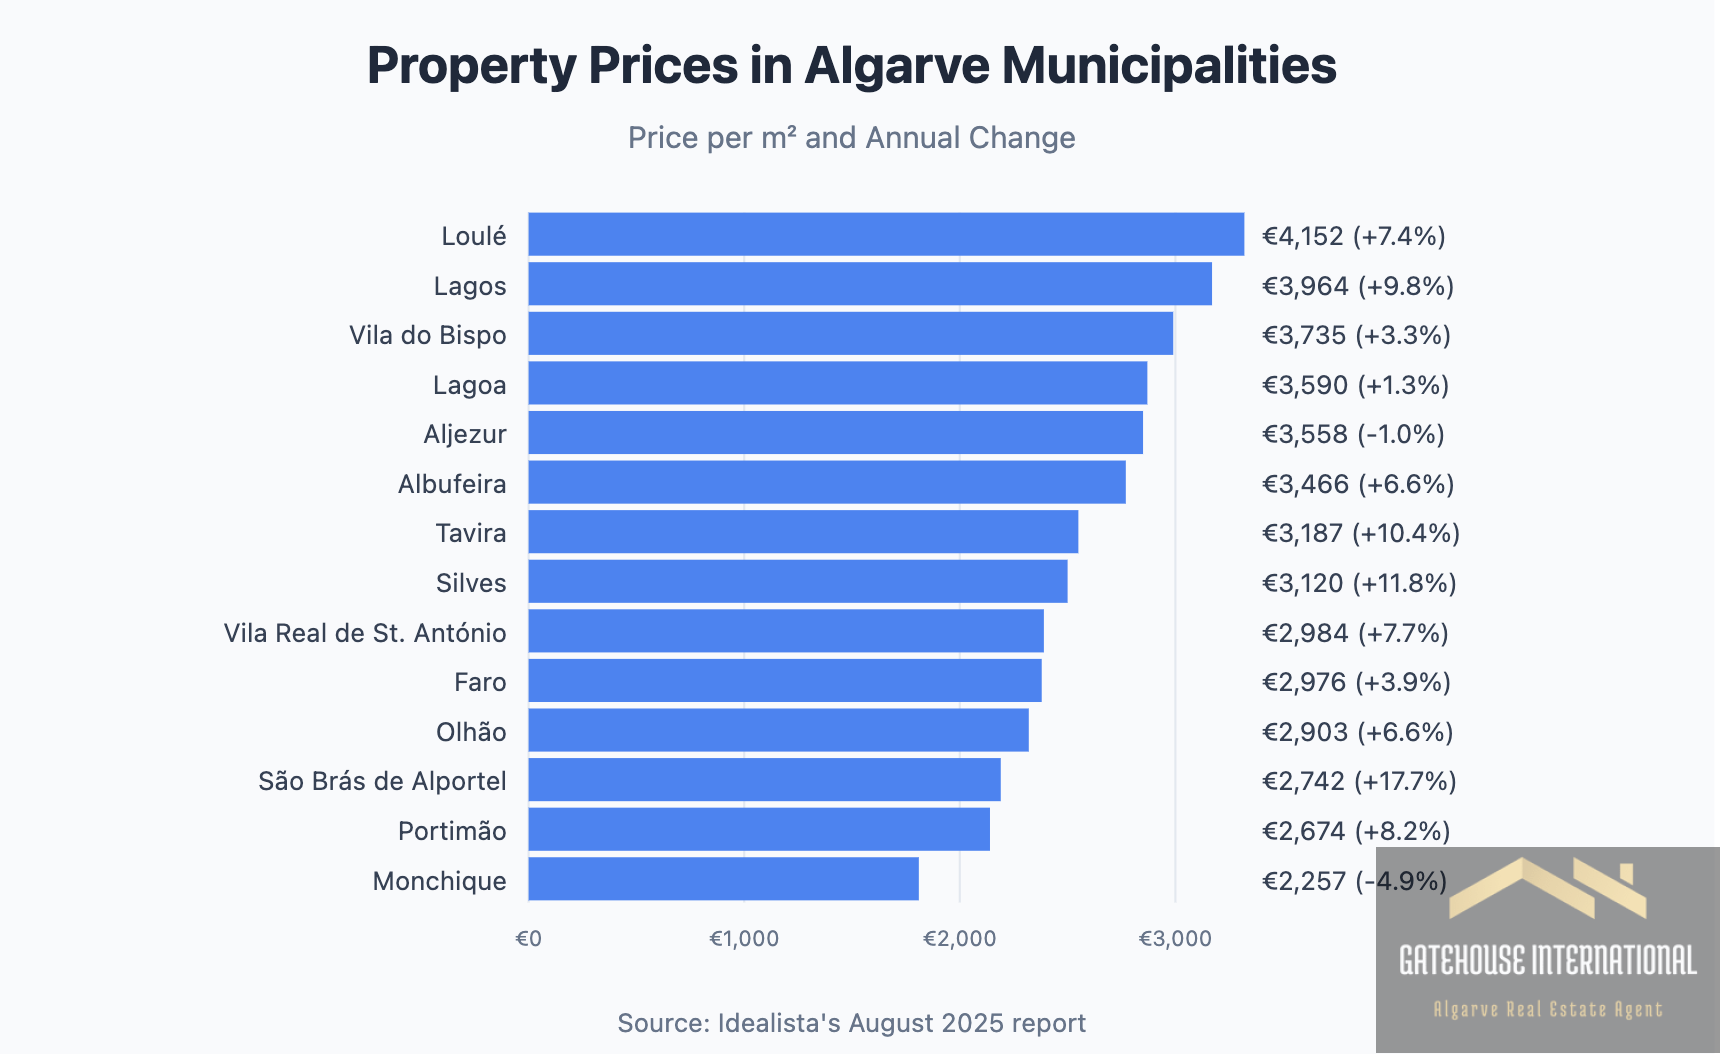
Municipality | Price per m² (€) | Annual Change (%) |
---|---|---|
Loulé | 4,152 | 7.4 |
Lagos | 3,964 | 9.8 |
Vila do Bispo | 3,735 | 3.3 |
Lagoa | 3,590 | 1.3 |
Aljezur | 3,558 | -1.0 |
Albufeira | 3,466 | 6.6 |
Tavira | 3,187 | 10.4 |
Silves | 3,120 | 11.8 |
Vila Real de Santo António | 2,984 | 7.7 |
Faro | 2,976 | 3.9 |
Olhão | 2,903 | 6.6 |
São Brás de Alportel | 2,742 | 17.7 |
Portimão | 2,674 | 8.2 |
Monchique | 2,257 | -4.9 |
Data sourced from Idealista’s August 2025 report.
Note: The above table provides a snapshot of property prices and annual changes in various municipalities within the Algarve region as of August 2025.
📌 Frequently Asked Questions (FAQs)
1. What are the current property prices in Portugal in 2025?
The average property price in Portugal in 2025 is €2,722 per square meter, with notable differences by region. Lisbon is the most expensive city at €5,634/m², while the Algarve’s average is €3,467/m².
2. Where are the cheapest places to buy property in the Algarve?
The most affordable municipalities in the Algarve are:
- Monchique – €2,257/m²
- Portimão – €2,674/m²
- São Brás de Alportel – €2,742/m²
- Olhão – €2,903/m²
3. Where are the most expensive properties in the Algarve?
If you’re looking for premium locations, the most expensive municipalities in the Algarve are:
- Loulé – €4,152/m²
- Lagos – €3,964/m²
- Vila do Bispo – €3,735/m²
4. What is the future outlook for Portugal’s real estate market?
House prices are expected to keep rising due to:
- High demand from foreign investors and digital nomads.
- Labour shortages in construction, make new builds expensive.
- Government initiatives focused on affordable housing.
Conclusion
Portugal’s real estate market in 2025 is characterised by record-high property valuations and significant regional variations in pricing. While the market presents lucrative opportunities for investors, challenges such as labour shortages and housing affordability persist. Government initiatives aimed at increasing affordable housing supply are steps toward addressing these issues, but their impact will likely be realised in the medium to long term.
Compare house prices in different regions of the Algarve in Portugal
How to compare property prices in the Algarve’s municipalities –
Here at Gatehouse International Mediação Imobiliária Lda we have houses for sale in all regions of the Algarve. You can compare the prices from one location to another using the compare feature which can be found on all of the property results pages. Please see the diagram below. Use the Heart to add to Favourites and Arrows heading in the opposite direction to compare up to 4 properties together on the same page.
![Infographic showing House Prices in the Algarve Municipalities in 2025](https://algarveprop.com/wp-content/uploads/2025/02/Infographic-showing-House-Prices-in-the-Algarve-Municipalities-in-2025-1024x627.png?v=1738843602)
Mark McLoughlin: A Passionate Explorer of Algarve’s Rich Heritage
For over 20 years, I’ve called the Algarve my home, immersing myself in its stunning landscapes, vibrant culture, and deep-rooted history. My passion lies in sharing this remarkable region’s unique beauty and stories through writing, photography, and helpful guides for those who live here or dream of making the Algarve their home.
As a Level 10 Google Local Guide, I’ve contributed extensively to showcasing the Algarve’s gems, from hidden beaches to historical landmarks, helping locals and travellers alike discover the best of what this southern paradise offers.